What is Dynamic Support Resistance Indicator ?
This indicator has been developed by using active fear and greed analysis of the market.
Support is the demand zone of any financial instrument and Resistance is the supply zone
of the same financial instrument. This demand and supply zone has been created in the price
level due to the fear and greed of the market participants over a horizon of time.
This proprietary indicator tries to capture the probable zones of the supply and demand
for a time frame in advance by calculating various parameters like price, volume,
volatility, short-term trend & long-term trend of a particular instrument. 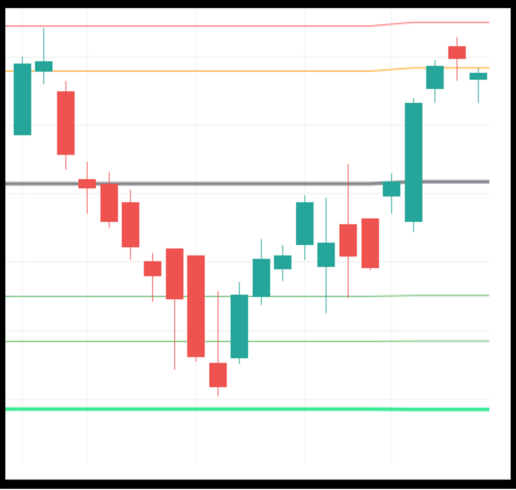 In this
financial model there is extensive use of behavioral finance which tries to capture the
market participants mindset and the probable reverse psychology that may trigger in the marked
zones by this propitiatory indicator. This is an Artificial Intelligence enabled indicator which
improves automatically with the time and more availability of the price volume volatility data
those are generated regularly. This custom designed propitiatory indicator enables market participant
to figure out a probable reverse level along with the stop loss level for any transaction.
It also describes probable high pace movement of the market above or below the extreme zones marked by
this indicator. This indicator has been tested on over 15 years of data by using Python automation
testing tool and the resulting accuracy of this proprietary indicator is over 92% till date.
In this
financial model there is extensive use of behavioral finance which tries to capture the
market participants mindset and the probable reverse psychology that may trigger in the marked
zones by this propitiatory indicator. This is an Artificial Intelligence enabled indicator which
improves automatically with the time and more availability of the price volume volatility data
those are generated regularly. This custom designed propitiatory indicator enables market participant
to figure out a probable reverse level along with the stop loss level for any transaction.
It also describes probable high pace movement of the market above or below the extreme zones marked by
this indicator. This indicator has been tested on over 15 years of data by using Python automation
testing tool and the resulting accuracy of this proprietary indicator is over 92% till date.